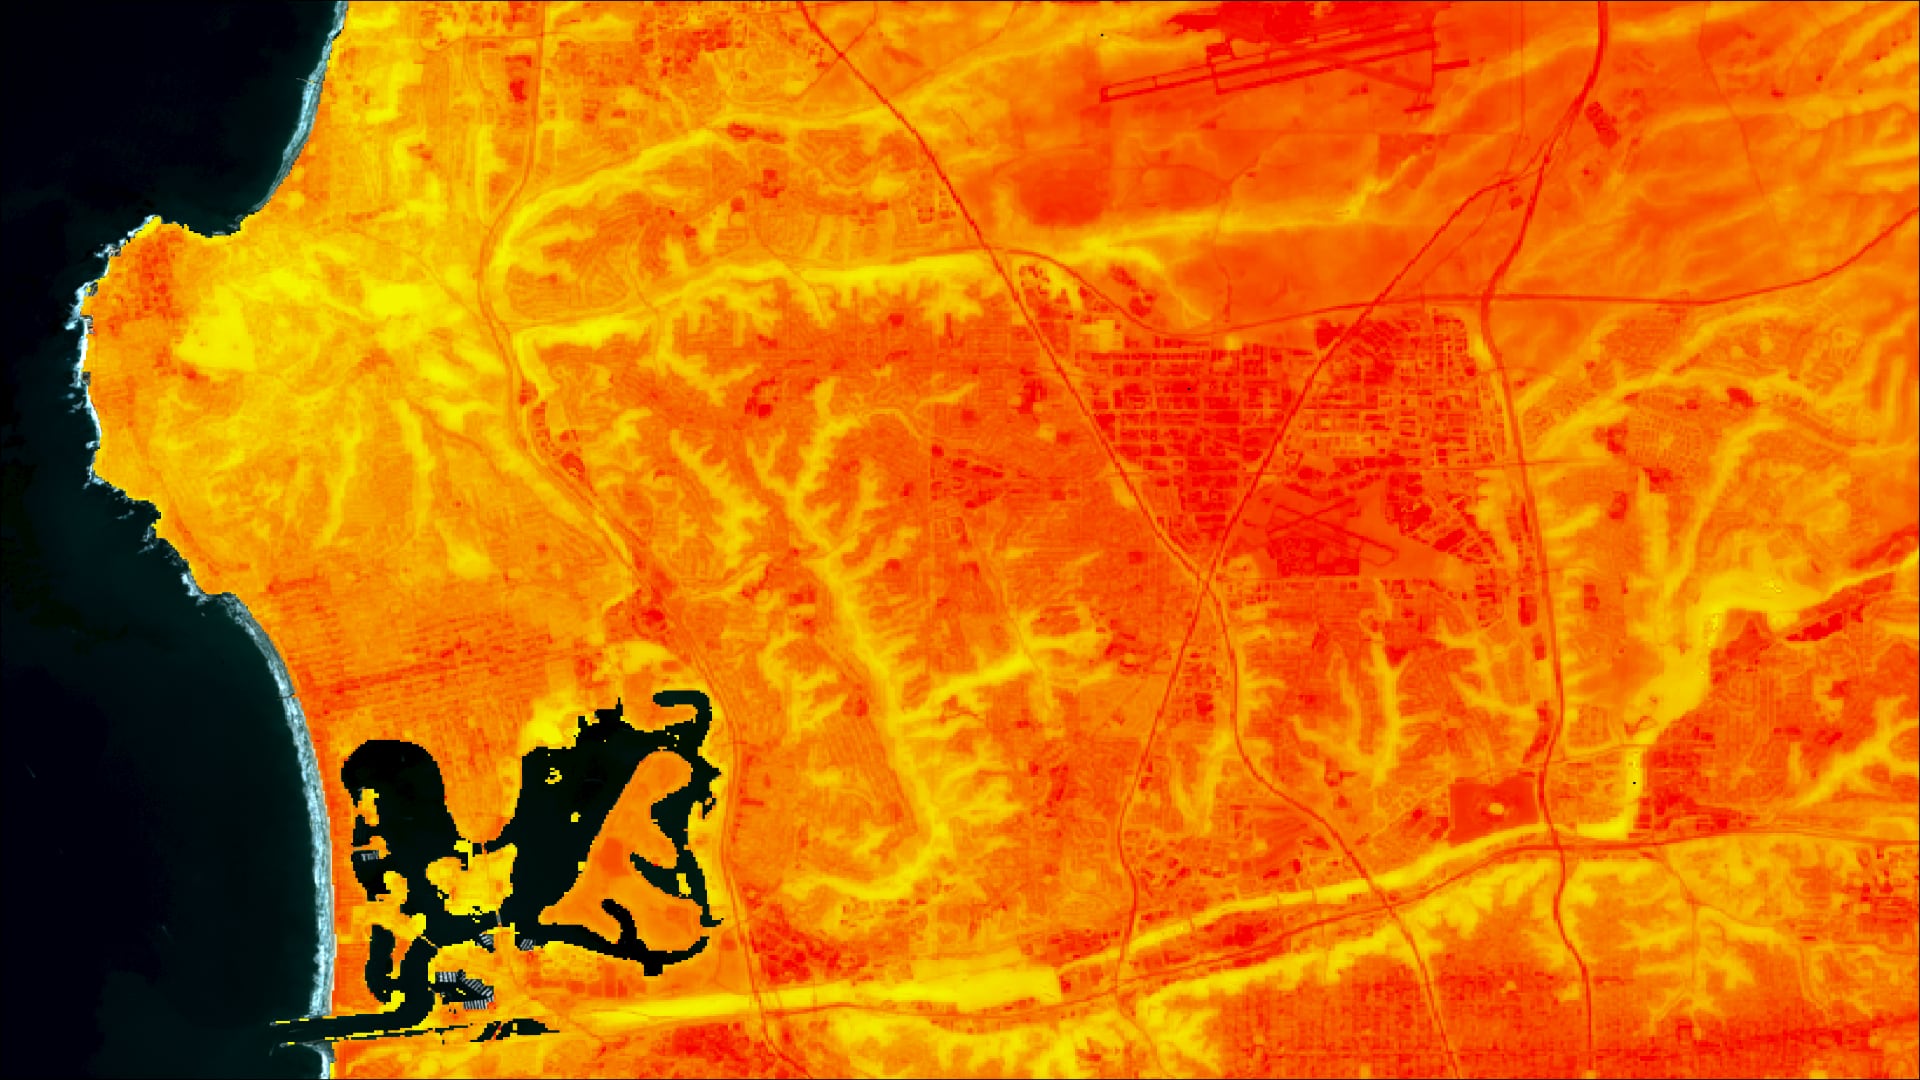
Utilizing NASA Earth Observations to Identify Drivers of Extreme Urban Heat and Generate a High-Resolution Vulnerability Index for Urban Planning and Climate Resiliency in San Diego, California
Exposure to heat exacerbated by an increase in urbanization as well as increasing global temperatures has become a growing concern for cities and their residents. Excess heat can cause increased heat-related morbidity, mortality, and energy costs. Vulnerability to heat-related illnesses is oftentimes correlated to demographics, socioeconomic status, and pre-existing health conditions. The City of San Diego, California boasts 1.4 million residents and, like many other major cities, has experienced increases in heat-related hospitalizations and mortality. The burden of urban heat is also not equal amongst communities; areas with lower income and communities of color bear a disproportionate burden. In partnership with the City of San Diego, and American Geophysical Union’s (AGU) Thriving Earth Exchange, the DEVELOP team used Landsat 8 Operational Land Imager (OLI) and Thermal Infrared Sensor (TIRS), and ECOsystem Spaceborne Thermal Radiometer Experiment on Space Station (ECOSTRESS) imagery to identify areas of highest heat based on land surface temperature from 2015-2020. Our analyses showed that health demographics such as obesity and cardiovascular health were the strongest indicators for heat vulnerability. In addition, various inputs (land use/land cover, tree canopy, and building intensity derived from the City of San Diego data along with albedo from Landsat 8) were used in the Integrated Valuation of Ecosystem Services and Tradeoffs (InVEST) urban cooling model to investigate changes in cooling rates in current and future scenarios for the city. The model results showed cooling has occurred due to a 5% increase in tree canopy. The City of San Diego can use these results to inform the development of the Climate Resilient SD plan and prioritize at-risk communities for cooling interventions.
- Location
- Arizona - Tempe
- Term
- Spring 2021
- Partner(s)
- City of San Diego, Planning Department
American Geophysical Union, Thriving Earth Exchange - NASA Earth Observations
- Landsat 8 OLI
Landsat 8 TIRS
ISS ECOSTRESS - Team
- John Dialesandro (Project Lead)
Meryl Kruskopf
M. Colin Marvin
Mireille Vargas - Advisor(s)
- Dr. Kenton Ross (NASA Langley Research Center)
Dr. David Hondula (Arizona State University)