Semi-Automated Mapping of Alaskan Wetland Inundation by Integrating Synthetic Aperture Radar and Optical Satellite Imagery
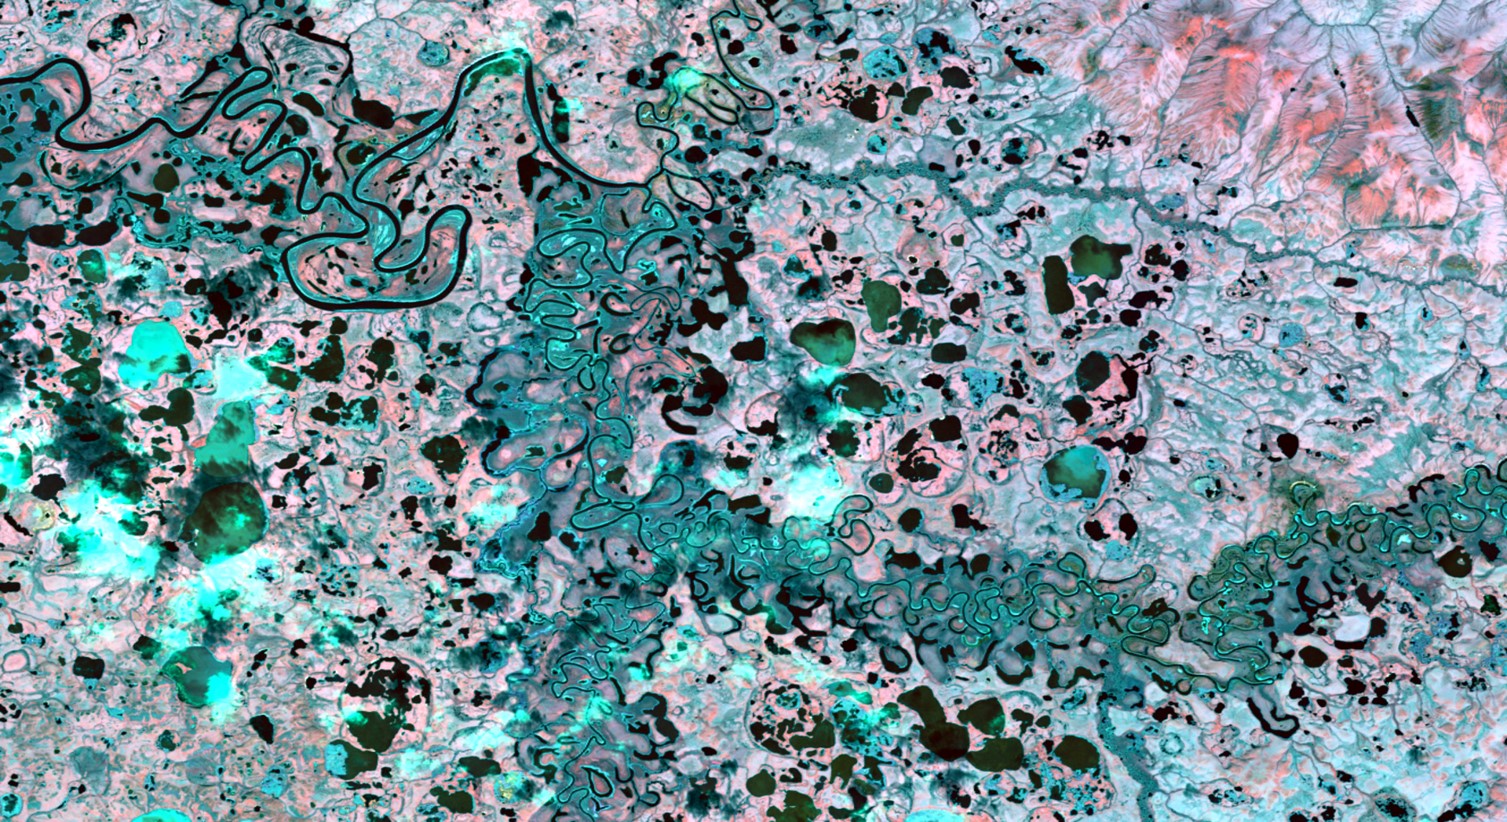
Alaska’s wetlands make up over a third of the state’s land cover and provide numerous ecosystem services, such as water filtration and storage, nutrient retention, and habitat to a diverse range of plant and animal species. Temporal variations in wetland inundation impact these ecosystem services, thus monitoring patterns and change is crucial for proper wetland management and future sustainability. The spring 2019 NASA DEVELOP Alaska Ecological Forecasting II team, in partnership with the Alaska Satellite Facility (ASF) and US Fish and Wildlife National Wetlands Inventory (USFWS NWI), built on the existing SAR Wetland Extent Exploration Tool (SWEET) created by the previous Alaska Ecological Forecasting team. The original features of SWEET included the creation of a land cover classification map showing wetland inundation using C-Band Synthetic Aperture Radar (C-SAR). This term, the tool additionally classified water regime based on inundation detected from a collection of multi-temporal C-SAR data. This new feature allowed for the analysis of inundation frequency, an attribute that gave important information on the behavior of wetlands throughout the year. The inundation tool was edited in a Jupyter Notebook and used radar data from Sentinel-1 C-SAR to create its inundation extent products. A new validation method that incorporated polygon data from the NWI was used to assess the accuracy of the inundation products created by the tool, in addition to validation using Landsat 8 Operational Land Imager imagery. With the addition of wetland frequency used in the assessment of SWEET products, end users were better equipped to analyze wetland extent by incorporating Alaska’s highly seasonal climate.
- Location
- California — JPL
- Term
- Spring 2019
- Partner(s)
- U.S. Fish and Wildlife Service, National Wetlands Inventory
Alaska Satellite Facility - NASA Earth Observations
- Sentinel-1 C-SAR
Landsat 8 OLI - Team
- Alana Higgins (Project Lead)
Adam Vaccaro
Annemarie Peacock
Roger Ly - Advisor(s)
- Bruce Chapman (NASA Jet Propulsion Laboratory, California Institute of Technology)