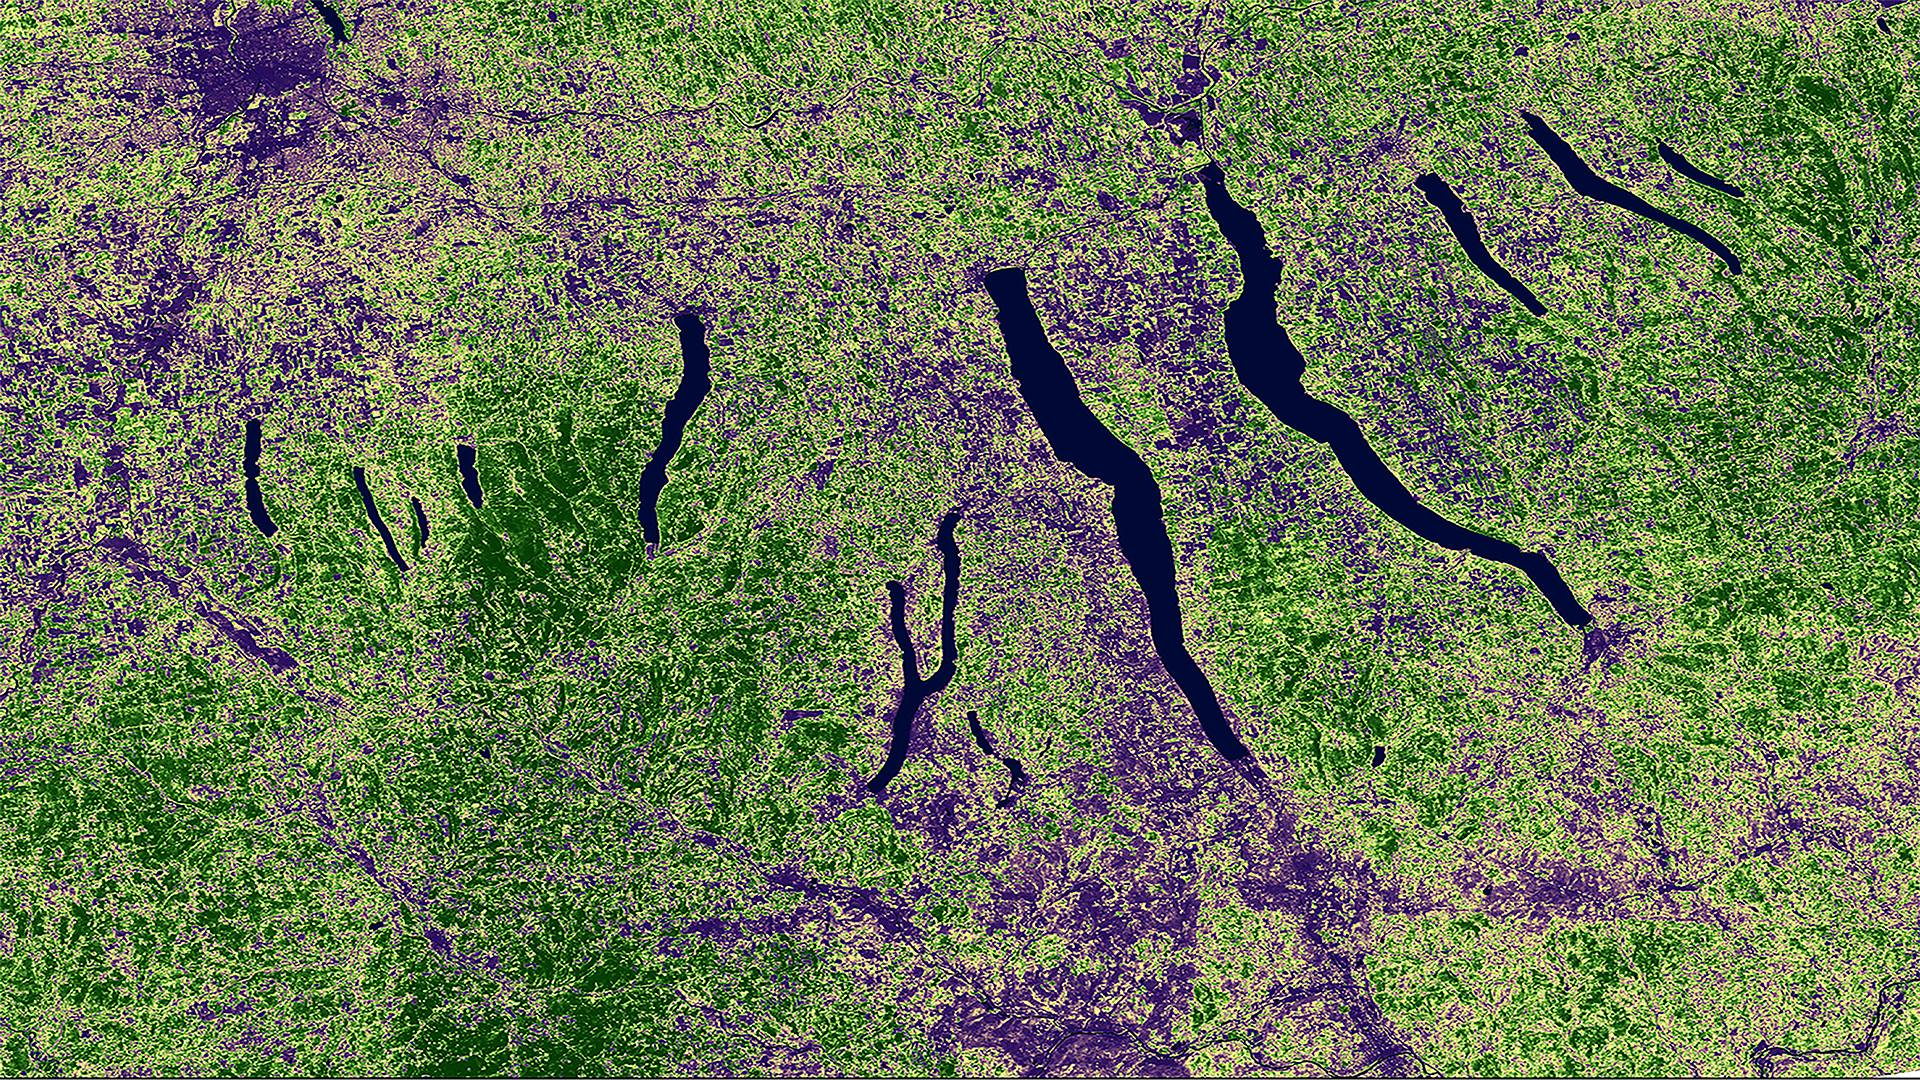
Identifying Environmental Stressors Impacting Sugarbush Longevity and Maple Syrup Agroforestry in the Northern Forest
Variable climate, anomalous weather conditions, and other environmental stressors impact sugar maples (Acer saccharum), the main source of maple syrup in the Northern Forest region. Maintaining sugar maple health and current syrup production levels is vital for the region’s cultural and economic livelihood. Our team partnered with the University of Vermont’s Extension Maple Program and Cornell Maple Program’s Uihlein Maple Research Forest to identify environmental stressors influencing sugarbush longevity and syrup production. This project expanded previous research completed in Vermont (VT) to New Hampshire (NH) and New York (NY). Terra Advanced Spaceborne Thermal Emission and Reflection Radiometer (ASTER), Landsat 5 Thematic Mapper (TM), Landsat 8 Operational Land Imager (OLI), and Sentinel-2A MultiSpectral Instrument (MSI) were used to create a habitat suitability model that identified optimal sugarbush locations. Time series analysis from January 1987 to September 2019 for Enhanced Vegetation Index (EVI) was used to show historical trends in vegetation across the study area. From North American Land Data Assimilation System Version 2 (NLDAS-2), the team conducted a climatological analysis of temperature, precipitation, and evapotranspiration during the sugar maple growing season (May through September) and temperature, precipitation, and snow depth during the sugar maple tapping season (January through April). Results in the Northern NY growing season temperature trend analyses showed a pattern of rising temperatures; the anomalous years were detected by the fitted smoothing trend based on the Locally Estimated Scatterplot Smoothing method. The study can be used by decision makers to better understand sugar maple habitat and resilience.
- Location
- Georgia — Athens
- Term
- Fall 2019
- Partner(s)
- University of Vermont, Extension Maple Program
Cornell Maple Program, Uihlein Maple Research Forest
University of New Hampshire, Cooperative Extension
University of Vermont Proctor Maple Research Center - NASA Earth Observations
- Terra ASTER
Landsat 5 TM
Landsat 8 OLI
Sentinel-2 MSI - Team
- Li-Wei Lin (Project Lead)
Hannah Goodson
Kate Markham
A. R. Williams - Advisor(s)
- Dr. Marguerite Madden (University of Georgia, Department of Geography)
Dr. Sergio Bernardes (University of Georgia, Department of Geography)
Dr. Kunwar Singh (North Carolina State University, Center for Geospatial Analytics)