Mapping Hotspots using NASA Earth Observations to Inform Future Green Initiatives in New York City
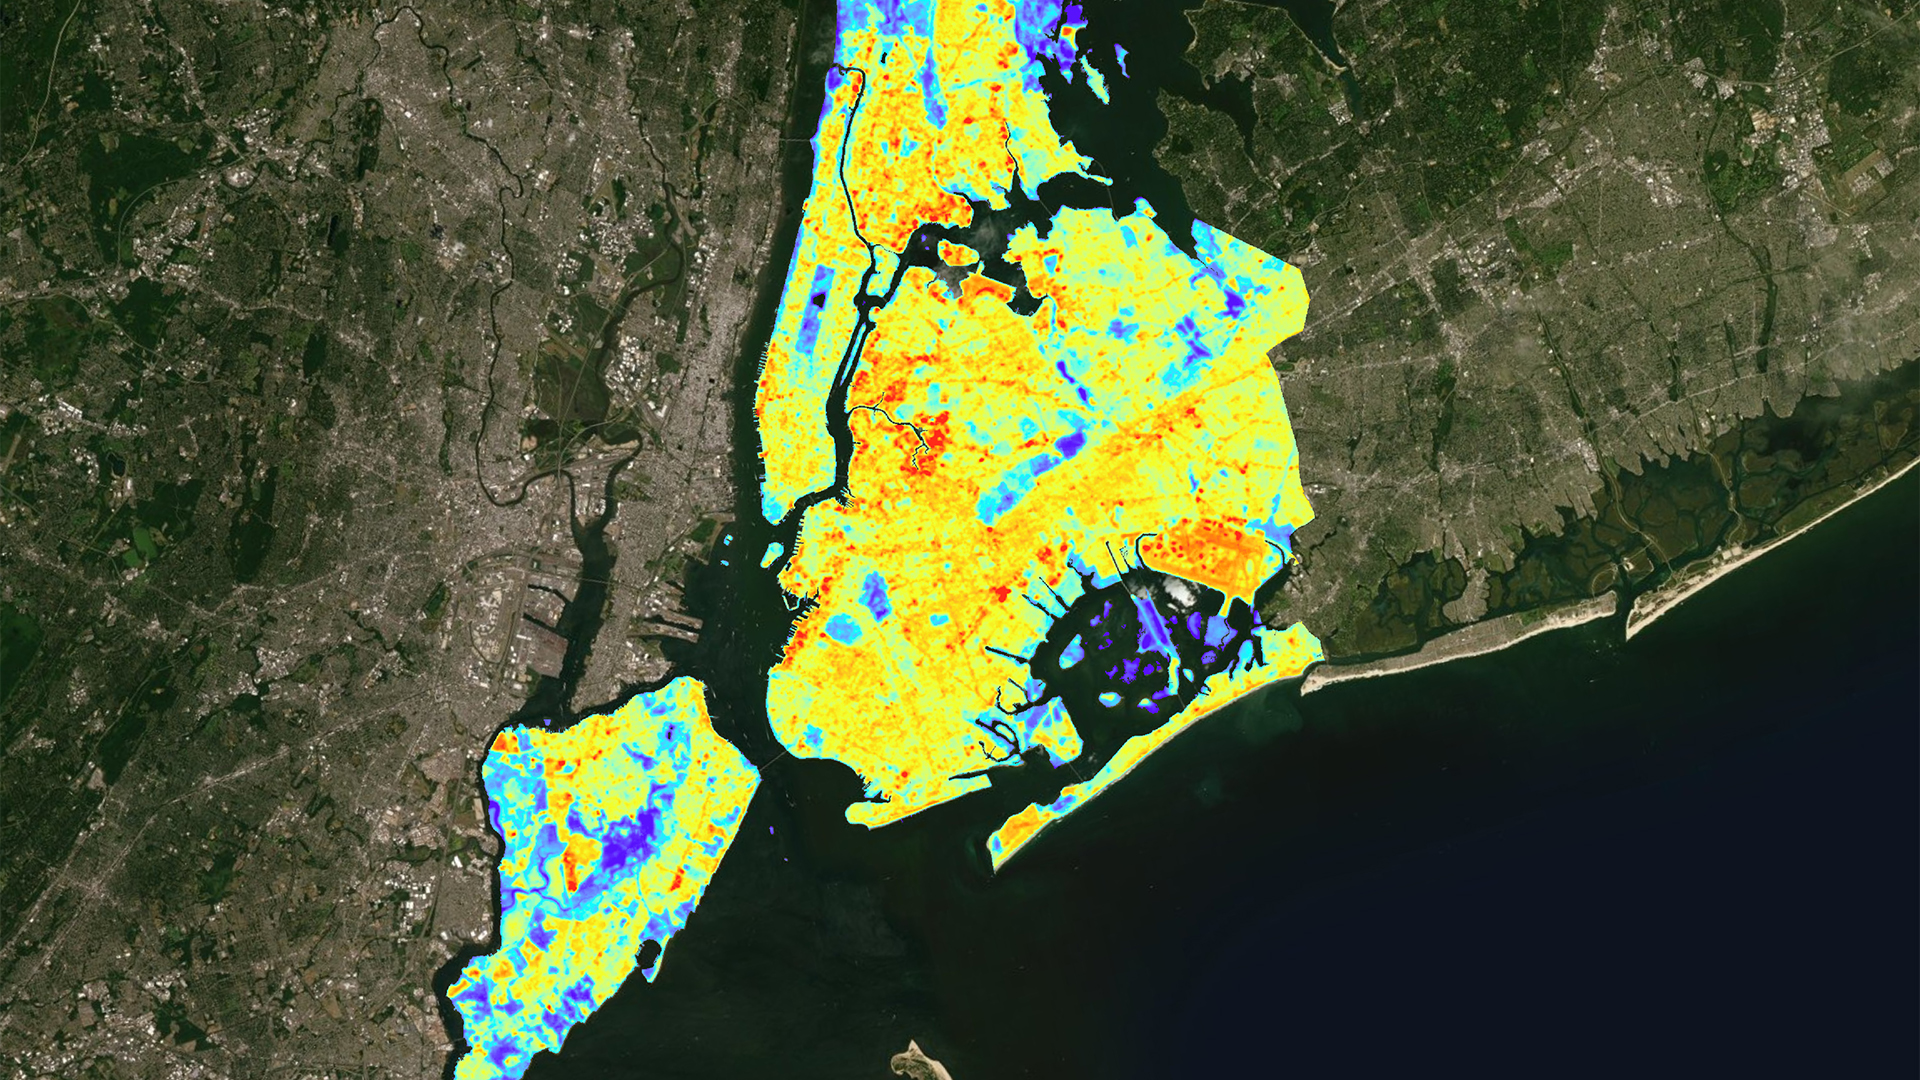
The effect of urban hotspots is a growing public health concern. In the face of climate change and urbanization, city dwellers are at increasing risk for heat-related illness and mortality. New York City (NYC) is especially vulnerable to heat-related illness because of extreme population density and projected population growth. A plan to mitigate the dangers of future heat-related illness is paramount. This project utilized NASA Earth observations to identify hotspots from 1990-2019 within the five boroughs of NYC and create geodatabases of hotspot locations, land use, and land cover. Earth observations utilized included Landsat 5 Thematic Mapper (TM), Landsat 7 Enhanced Thematic Mapper (ETM+), and Landsat 8 Operational Land Imager (OLI) and Thermal Infrared Sensor (TIRS). Location of hotspots were spatially and temporally mapped in conjunction with land use and land cover change obtained from the National Land Cover Database (NLCD). Both hotspot location and intensity changed throughout time, and occurrence of temperature hot spots tended to match zonal features. Results show that higher than average temperatures correlated to increased development while lower than average temperatures were associated with vegetation, bare land, and open water. Our partners at the City of New York Mayor’s Office of Resiliency and NYC Department of Health and Mental Hygiene will utilize the results to inform green initiatives, helping to reduce the incidence of heat-related illness in the most at-risk neighborhoods.
- Location
- Virginia — Langley
- Term
- Fall 2019
- Partner(s)
- City of New York Mayor’s Office of Resiliency
New York City Department of Health And Mental Hygiene - NASA Earth Observations
- Landsat 4 TM
Landsat 5 TM
Landsat 7 ETM+
Landsat 8 OLI
Landsat 8 TIRS - Team
- Scott Harrison (Project Lead)
Josi Robertson
Luis Garcia Falcon
Brianna McCardle - Advisor(s)
- Dr. Kenton Ross (NASA Langley Research Center)
Sydney Neugebauer (NASA Langley Research Center, DEVELOP Fellow)