Arizona Health & Air Quality II

Enhancing Extreme Heat Intervention and Preparedness Activities in Maricopa County, Arizona with NASA Earth Observations
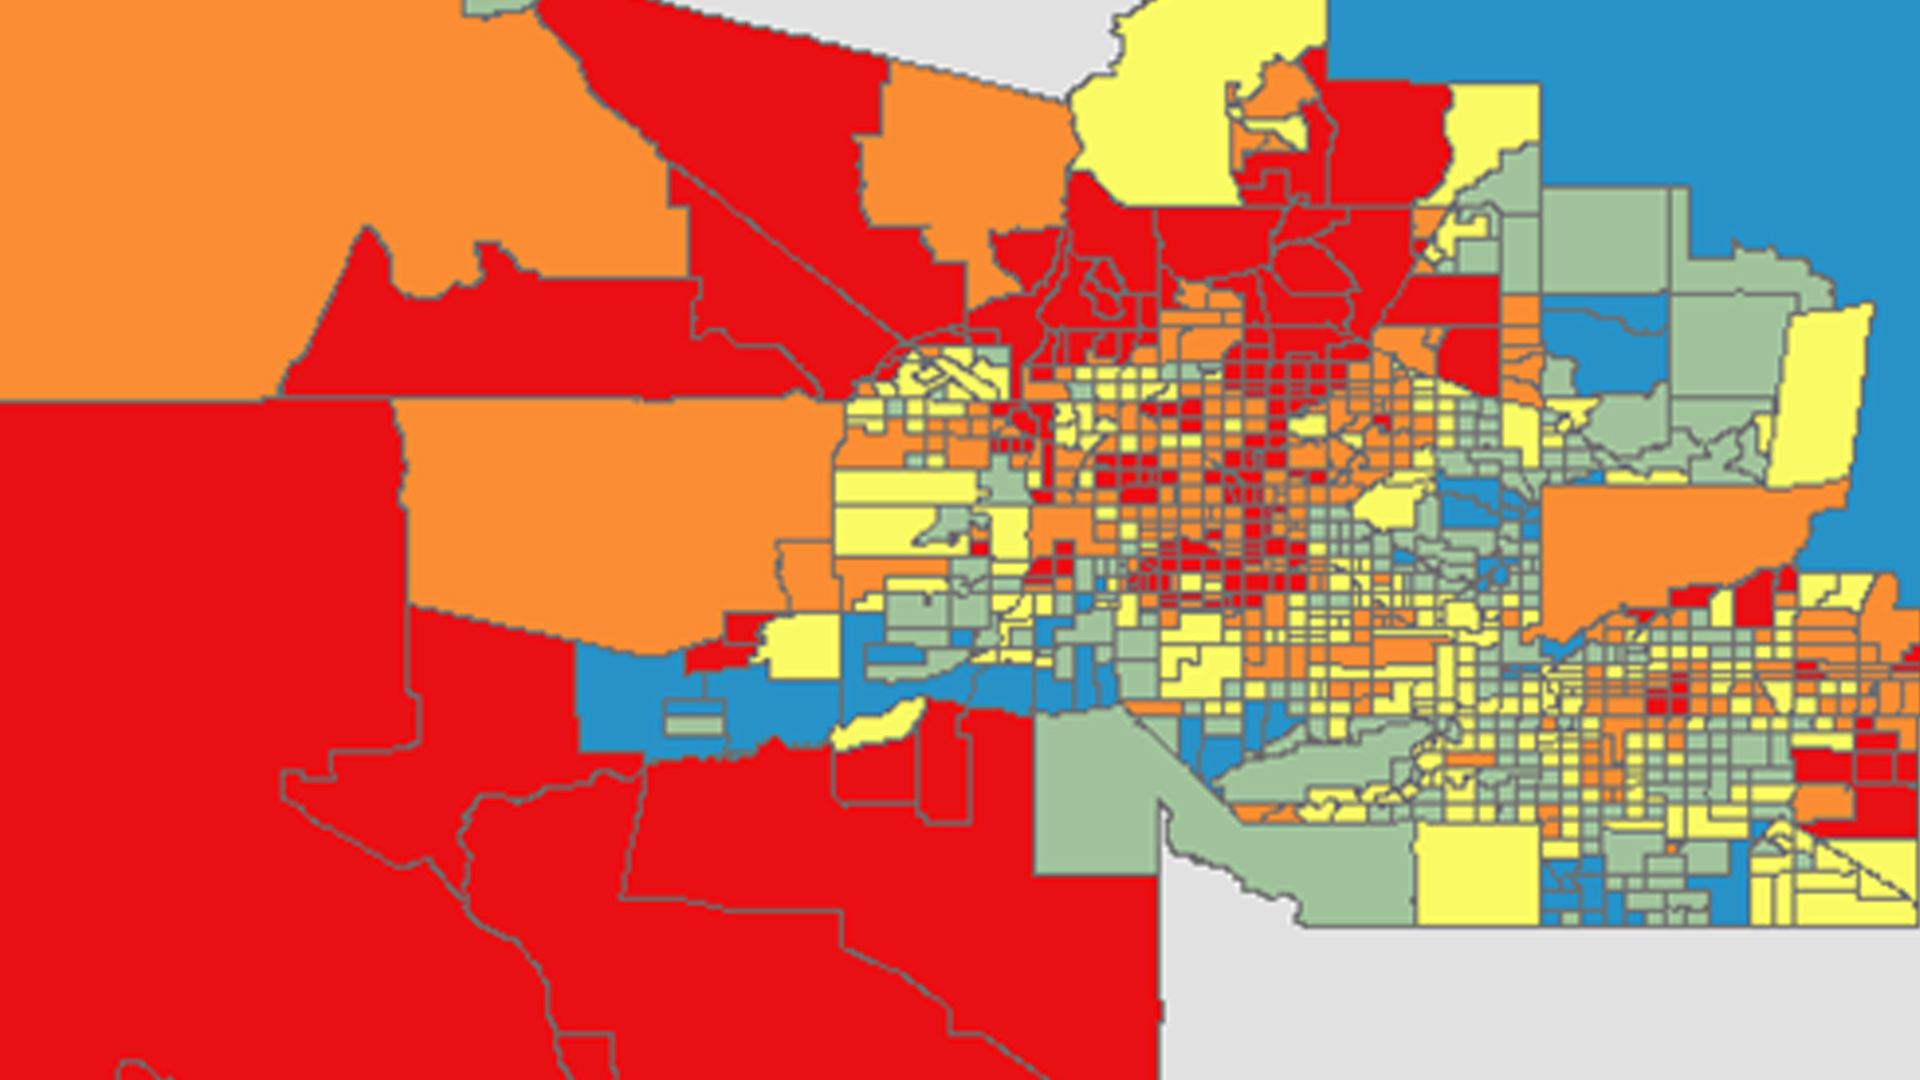
Extreme heat causes and exacerbates a number of health problems, leading to hospitalization and death in some cases. The problem of severe heat is notably felt in Maricopa County, Arizona, where the socially disadvantaged and physically vulnerable are especially susceptible to the effects of extreme heat. Within the Maricopa County limits is the city of Phoenix, a dense urban area surrounded by 300-2,000 m ridge lines above the valley floor. The volume of impervious surfaces, lack of shade and vegetation, and the high ridge lines surrounding the city exacerbate the heat stress by a phenomenon known as the urban heat island effect (UHI). After the sun sets, heat retained by impervious building materials is released at a decreased rate compared to natural vegetation and soil coverage. Ambient air temperatures in urban areas tend to be higher than the surrounding rural areas. Several organizations, including the Arizona Department of Health Services and the Phoenix Heat Relief Network, are working to create more effectively placed cooling centers and heat warning systems to aid those with the highest risk of exposure. This project created a Python tool using Aqua Moderate Resolution Imaging Spectroradiometer (MODIS) land surface temperature parameters to generate heat maps that reference demographics data on extreme heat days. In addition to this, using the resources available at the Atmospheric Science Data Center (ASDC) will allow for access to near real-time data acquisition, which will aid the partners in providing spatially distributed relief during extreme heat events.
- Location
- NASA Langley Research Center
- Term
- Spring 2016
- Partner(s)
- Arizona Department of Health Services (ADHS
Phoenix Heat Relief Network
National Weather Service, Phoenix Forecast Office
Arizona State University, Center for Policy Informatics (CPI) - NASA Earth Observations
- Aqua, MODIS
Terra, ASTER
Landsat 8, OLI - Team
- Daniel Finnel (Project Lead)
Teresa Fenn
Richard Muench
Ashley Brodie
Derrick Hunter - Advisor(s)
- Kate Goodin (Maricopa County Department of Public Health)
Dr. Kenton Ross (NASA Develop National Program)
Dr. Dave Hondula (Arizona State University)
Lance Watkins (Arizona State University)
Project Video