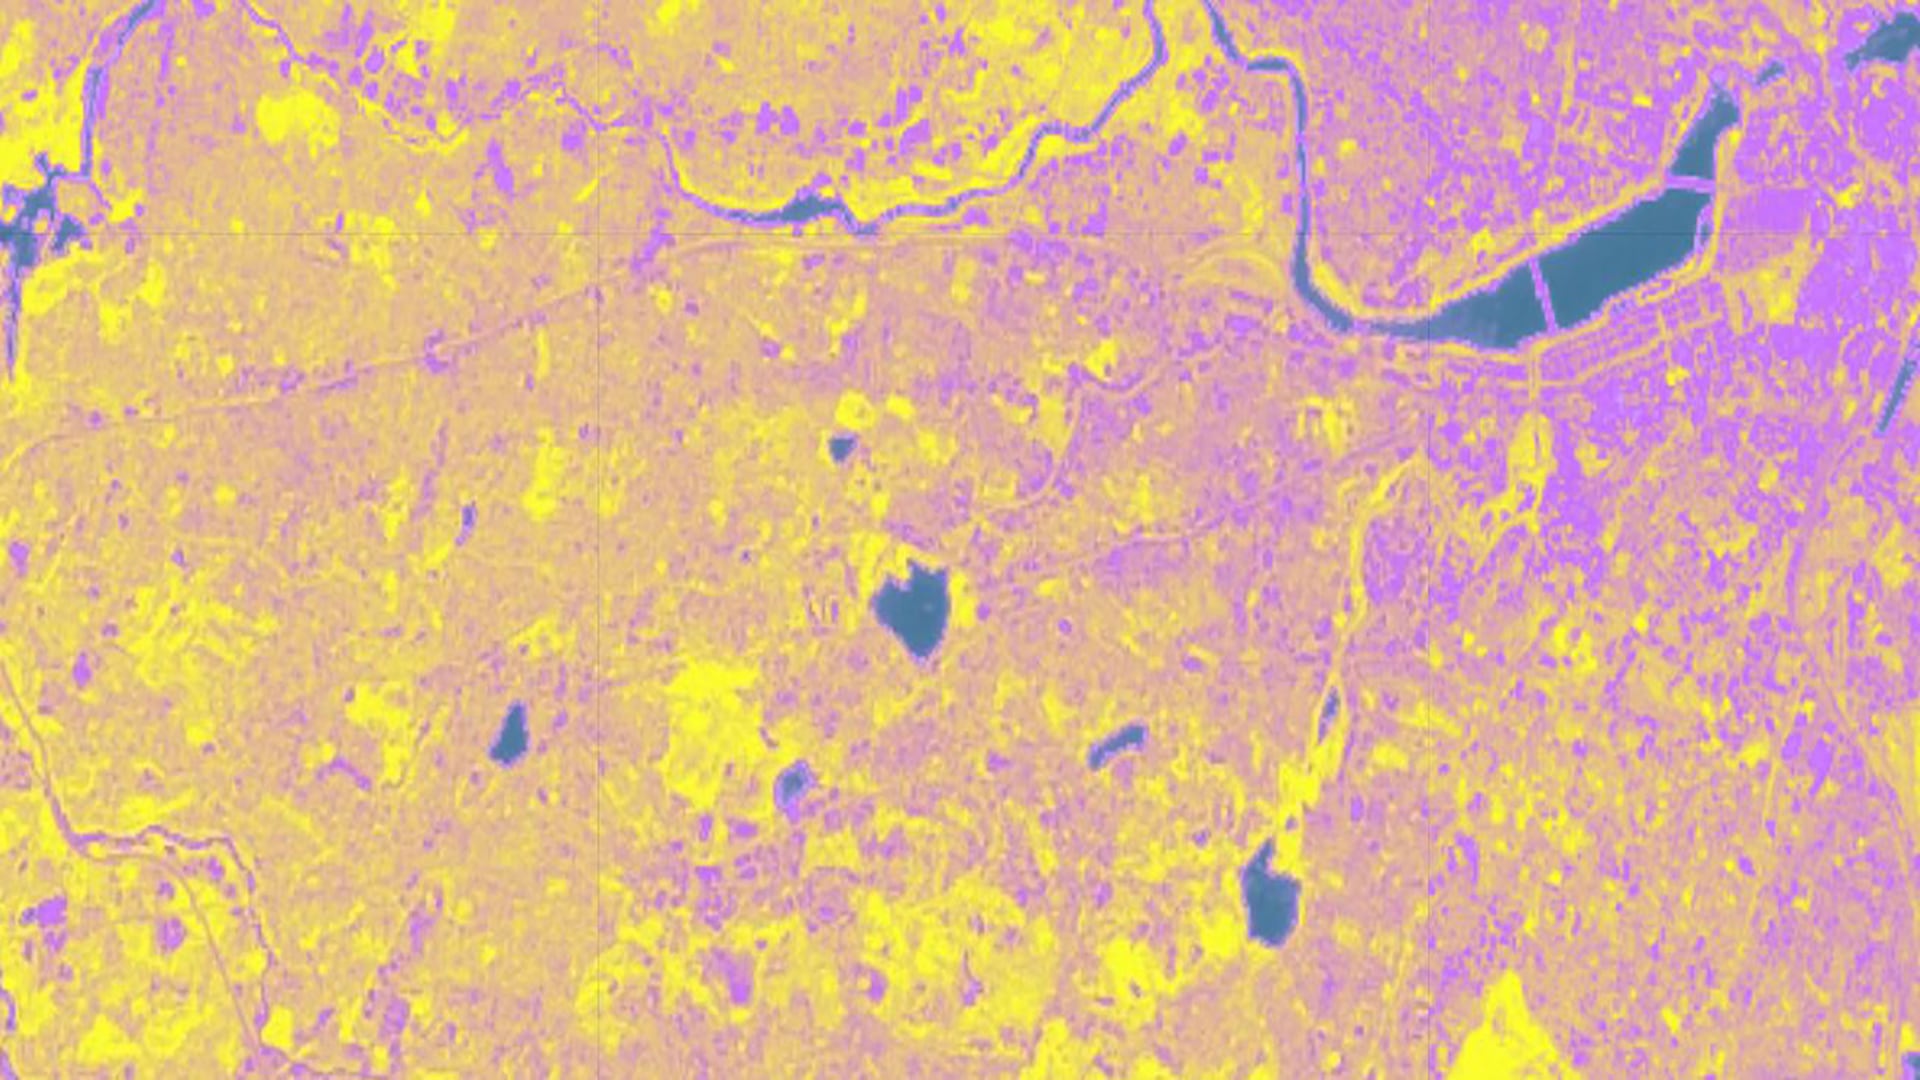
Assessing Flooding Vulnerability to Assist High Water Intervention and Urban Planning Programs in the Charles River Watershed
The Charles River watershed intersects 35 municipalities within the Boston Metropolitan Area and has a population of 1.2 million, making it one of the most densely populated watersheds in New England. In recent years, the watershed has observed higher rates of flood inundation, mainly due to increased development, extreme precipitation events, and increased surface runoff. As the frequency of flood events increases and a changing climate poses an ongoing threat to local communities, governments, and organizations in Massachusetts need accurate flood risk assessments. This project partnered with the Charles River Watershed Association, the Town of Natick’s Office of Sustainability, and the Massachusetts Audubon Society to assess the potential for watershed degradation, flood vulnerability, and flood susceptibility in the watershed. The team used Landsat 5 Thematic Mapper (TM), Landsat 8 Operational Land Imager (OLI), Sentinel-1 C-Band Synthetic Aperture Radar (C-SAR), and Sentinel-2 MultiSpectral Instrument (MSI) to assess the feasibility of identifying flood events using remote sensing. After identifying images that overlapped with the reported flood events, the team concluded that it was not feasible to use Earth observation data to detect localized flooding. Instead, the Federal Emergency Management Agency (FEMA) 100-year floodplain was used as a proxy for areas where flooding may occur. The team used statistical analysis and supervised classification to develop a flood susceptibility map, incorporating factors like soil drainage, height above nearest drainage, and topographic wetness index. This was overlaid with demographic and socioeconomic data to create a flood vulnerability map. The flood susceptibility map captured over 2/3 of reported flood events in the watershed, an improvement over the 1/3 of events captured by the FEMA 100-year and 500-year floodplain maps.
- Location
- Massachusetts - Boston
- Term
- Fall 2020
- Partner(s)
- Town of Natick, Office of Sustainability
Massachusetts Audubon Society
Charles River Watershed Association - NASA Earth Observations
- Landsat 5 TM Surface reflectance
Landsat 8 OLI
Sentinel-1 C-SAR
Sentinel-2 MSI - Team
- Trista Brophy (Project Lead)
Willow Coleman
Anna Garik
Will Peters - Advisor(s)
- Dr. Cedric Fichot (Boston University)
Dr. Kenton Ross (NASA Langley Research Center)